Understanding Google Page Speed Insights and Lighthouse
Web performance has become a critical aspect of any online business or organization. A slow-loading website can lead to frustrated users, decreased engagement, and ultimately, lost revenue. To help address this issue, Google introduced two powerful tools: PageSpeed Insights, which is another name for and powered by its framework Google Lighthouse.
What is Page Speed Insights?
PageSpeed Insights is a free tool developed by Google that analyzes the performance of web pages and provides recommendations for improvement. It uses various metrics to measure how quickly a page loads on different devices and networks, providing insights into areas where optimization can be improved.
PSI generates two scores: a desktop score (out of 100) and a mobile score (out of 100). The higher the score, the better the performance of your website. PSI also provides suggestions for improvement based on its analysis, categorized by opportunity cost – essentially, how much each suggestion is worth in terms of improving page load time.
What is Lighthouse?
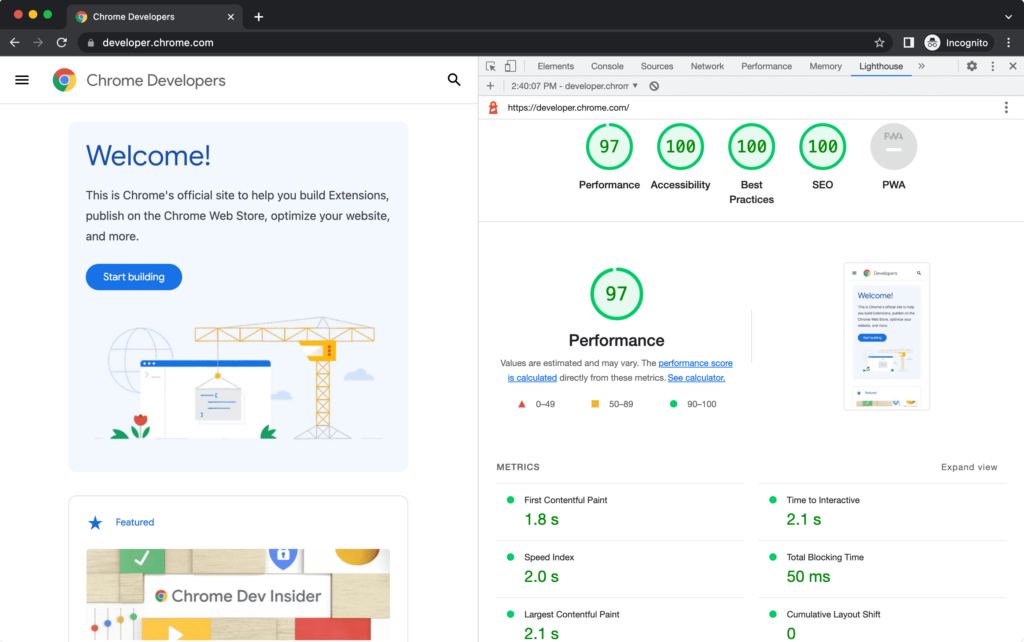
Lighthouse is an open-source auditing tool developed by Google that evaluates web pages and applications against a set of best practices and performance metrics. It provides detailed reports highlighting areas for improvement across various categories:
- Performance: Measures the execution speed, paint times, and other aspects affecting page load.
- Accessibility: Evaluates how well your website adheres to Web Content Accessibility Guidelines (WCAG 2.1).
- Best Practices: Checks if you’re following best practices for web development, such as using semantic HTML5 elements or providing ARIA attributes where necessary.
Lighthouse generates a report that highlights areas of improvement across these categories and provides actionable suggestions to enhance your website’s performance, accessibility, and overall user experience.
Resources:
Main Metrics Used in Lighthouse / Page Speed Insights
Here are the key metrics used in both tools:
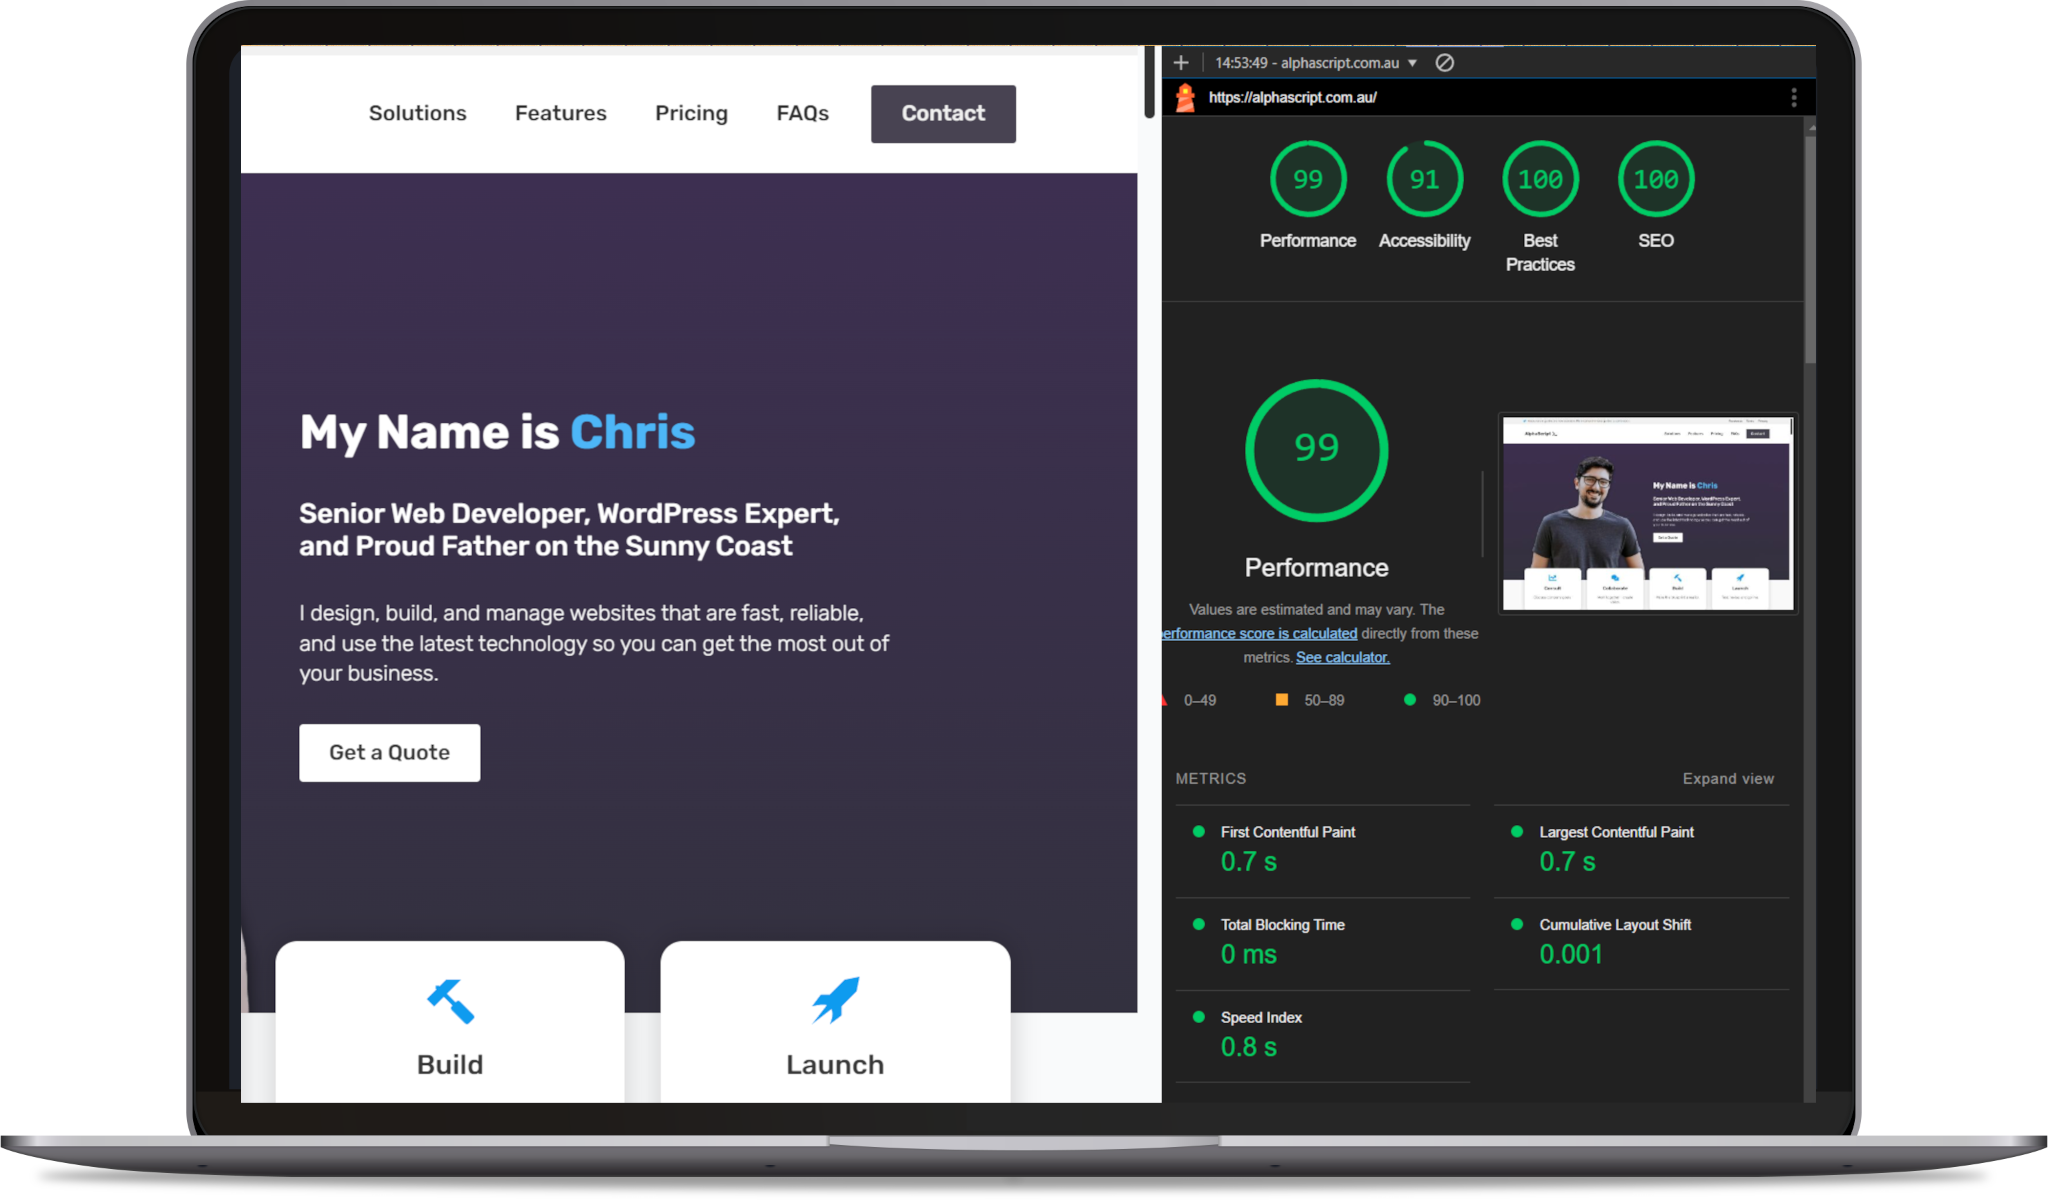
- First Contentful Paint (FCP): Measures the time it takes for the browser to render its first bit of content.
- Speed Index: Evaluates how quickly a page’s visible content loads, with lower values indicating better performance.
- Largest Contentful Paint (LCP): Estimates the perceived load speed based on when the largest image or block element is rendered within the viewport.
- Total Blocking Time (TBT): Calculates time spent blocking user interaction due to JavaScript execution and layout shifts.
How Lighthouse Works
Here’s a step-by-step overview of how Lighthouse works:
- The tool uses Google Chrome DevTools under-the-hood for its analysis, allowing it to simulate various network conditions.
- It fetches your website using the specified URL or file path.
- Once loaded, Lighthouse evaluates performance metrics like FCP and Speed Index by taking snapshots of the page at specific points during rendering.
- After analyzing these metrics, it generates a report highlighting areas for improvement.
Understanding Your Score & Recommendations
It’s important to note, that while Page Speed Insights/Lighthouse is a useful tool, it is just that – a tool for measurement. When you see a score, especially if it is a low one, it can give you a false indicator of overall performance if you haven’t fully grasped what it is evaluating. The inverse is true as well of a good score, giving you a false sense of having a perfect site. Neither is true.
For example, a low speed score may not actually reflect real-world speed. I’ve seen this a lot, with a page visible and loaded in under 2 seconds, but being flagged as taking 10+ seconds. The reason for this is that Lighthouse is simulating the page load and interpreting it using standardised measurements – it isn’t actually a user going to the page and trying to do things. This is an important distinction because your users may be happy with the performance, while Google thinks that a conditionally loaded script, lazy loaded image, or even animation effect is actually impacting performance (when often it is intentional and completely fine).
On the other hand, a high score overall may look great on paper, but when your users go to the site they notice text popping in, or other items on the page looking strange before they are ready, because you have optimised and removed render-blocking resources from your page. Although Lighthouse recommends this, the user experience can be negatively affected, so it’s important to balance the real-world experience with the simulated one.
What I usually recommend to clients is to not chase a score. Look at the “opportunities” discovered by the tool and independently evaluate on whether they are impactful or not, whether you can actually see those issues reflect in a real-world way, and of course if it relates to a problem that your customers/user base complains about.
How to Run The Tools
Page Speed Insights (PSI)
Running the tool online is very straightforward, but I have found to be the less reliable/accurate option for various reasons. The main one is that is uses both real-world data and lab data/averages to assess your score. Because of this, the qualitative evaluation you get could potentially be different from the real-world one.
However, I still recommend that you use it as there is undoubtedly an impact to SEO if Google even thinks your site is slow, even if it is somewhat opinionated. It is also the same tool that is used in evaluations made in Search Console. So if you improve your score here, it will reflect in the Search Console as well over time.
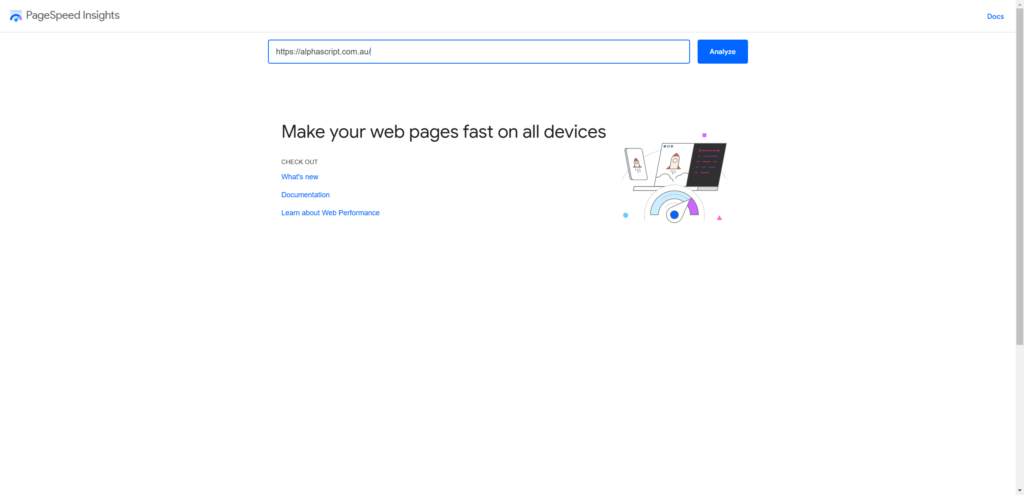
To use the tool, simply go to their website, https://pagespeed.web.dev/, and enter in your full site url. I typically start with the home URL first, so https://alphascript.com.au/ for example. Very easy – so it has that going for it!
Google Lighthouse (In your browser)
While PSI is a great starting point, I recommend using the more accurate and reliable option: running Google Lighthouse directly in Chrome DevTools. This method provides you with a detailed report on performance metrics, accessibility, best practices, and SEO suggestions – all while still using the same standardised assessment previously mentioned, but without the lab data.
- Open your website: Make sure you have your website open in a new tab of the browser.
- Go to Developer Tools: Press
F12or right-click anywhere within the webpage and select “Inspect” (or pressCtrl + Shift + I) on Windows/Linux, or useCmd + Opt + Jon Mac. - Switch to Lighthouse Tab: Within Chrome DevTools, click on the three dots at the top-right corner of the Elements tab and select More tools > Lighthouse from the dropdown menu. Alternatively, you can also access Lighthouse directly by pressing Ctrl + Shift + E (Windows/Linux) or Cmd + Opt + R (Mac).
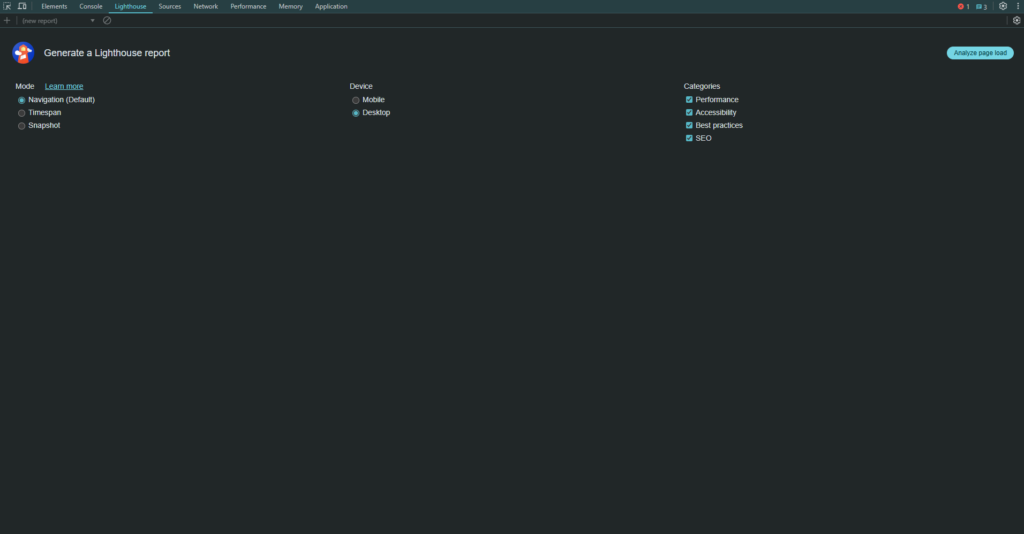
- Run a New Audit: Click on the “Analyze page load” button in the top-left corner of the Lighthouse tab.
- Select Your Options: Choose the type of audit you want to run, such as Performance, Accessibility, Best Practices, SEO, or all four.
- Run the Audit: Click on the “Analyze page load” button again to start the analysis process.
- Review Your Results: Once complete, you’ll be presented with a detailed report highlighting areas of improvement across performance metrics, accessibility, best practices, and SEO suggestions.
IMPORTANT: Make sure you run Lighthouse in a “Guest” tab. By default, it runs everything, including extensions, in its evaluations. If you run it in guest mode, this will avoid your extensions from having a false impact on the evaluation.
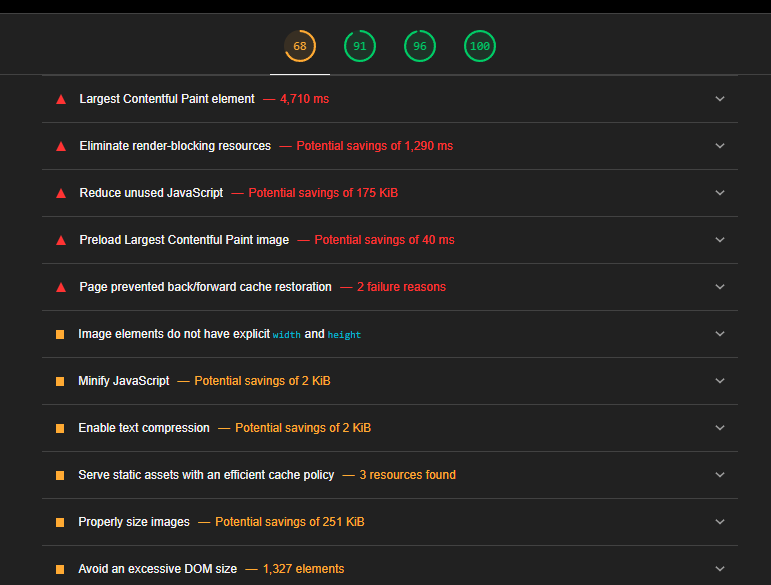
Top 7 High Impact Items Found by Lighthouse
- Slow Server Response Times: Long server response times can delay your website’s initial load.
- Render-Blocking Resources: When scripts or stylesheets load before other critical elements on your page.
- Large images: Many sites have large image files that contribute to slow page loads.
- Unused CSS stylesheets: Outdated or unnecessary CSS stylesheets can lead to bloated codebases and slower rendering times.
- Inefficient JavaScript libraries: Some libraries may be using outdated versions, causing compatibility issues and slowing down your site’s performance.
- Missing alt text for images: Failing to provide descriptive alternative text (alt text) for images makes them inaccessible to users with visual impairments or screen readers.
- Poorly optimized HTML structure: Unclear or redundant semantic markup can hinder accessibility, search engine optimization, and overall page load speed.
1. Slow Server Response Times (Medium)
Infrastructure issues can often lead to slow performance across all items, so this one is potentially the most impactful, as it limits every other aspect of your site and the effectiveness potential of your improvements.
Potential improvements include:
- Optimize database queries by reducing query complexity and using indexing
- Implement caching mechanisms (e.g., Redis) to store frequently accessed data
- Consider upgrading or scaling your hosting infrastructure for improved performance
2. Render-Blocking Resources (Hard)
This is one of the harder items to fix as it involves a lot of manual work to determine how/when to load resources, usually requiring the expertise of a developer. This can also potentially break a lot of other things if not executed perfectly, since scripts can fail and often require a specific load order.
A general approach to addressing this finding:
- Move non-critical CSS files (e.g., vendor libraries) below the initial paint
- Use asynchronous loading for third-party scripts and lazy-load them only when necessary
- Prioritize essential resources, like fonts or JavaScript code required for user interactions
3. Large images (Easy)
Images that are too large or lacking compression will often be one of the biggest contributors to slowing down page’s load time. There are a lot of options for improvement here:
- Use a plugin like Smush, EWWW, Converter for Media to compress your images in the same format
- Also use these plugins to support newer image encoding formats like .webp or .avif, saving even further without a noticeable loss in quality
- Use
srcsetmarkup with your images to indicate different sizes for an image based on screen size - Lazy load images below the fold. Most themes, builders, and even WordPress core support this, which is effectively just loading the resource only when it is in the viewport (not the whole page at once).
4. Unused CSS stylesheets (Hard)
Outdated or unnecessary CSS stylesheets can lead to bloated codebases and slower rendering times.
- Identify unused CSS files by reviewing your website’s stylesheet hierarchy
- Remove redundant or outdated stylesheets from your project
- Consider using a tool like PurifyCSS to automate the process of removing unused selectors
5. Inefficient JavaScript libraries (Medium)
Some libraries may be using outdated versions, causing compatibility issues and slowing down your site’s performance.
- Identify which JavaScript libraries are being used on your website
- Check if newer versions with improved performance or security features are available
- Update the library version accordingly
- Use a CDN to cache certain libraries and offload
- Load scripts asynchronously or with defer when possible
6. Missing alt text for images (Easy)
Failing to provide descriptive alternative text (alt text) for images makes them inaccessible to users with visual impairments or screen readers.Review your website’s image content and add missing alt text attributes where necessary
- Review your website’s image content and add missing alt text attributes where necessary
- Use tools like Ahrefs’ Image Checker or SEMRush to identify images without alt tags, or just manually review your Media Library in WordPress and add alt tags to everything
- Consider using an SEO plugin like Yoast or SEOPress, where you can just auto-add alt tags on upload and even use AI to generate the info
7. Poorly optimized HTML structure (Medium/Hard)
Unclear or redundant semantic markup can hinder accessibility, search engine optimization, and overall page load speed.
- Use a better theme or page builder like Breakdance to have improved control over your markup
- Hire a developer to rebuild your website in a proper structure
Resources:
How These Metrics Affect Your Website
Google Page Speed Insights (PSI) and Lighthouse are powerful tools that can help you optimize your website’s performance by identifying areas for improvement across various metrics such as FCP, TTFB, DOM Interactive time. These items usually translate to real-world improvements:
- Improved User Experience (UX): Enhances user engagement by reducing wait times, improving page load speed.
- Increased Search Engine Rankings: Helps you optimize your website’s performance to meet search engine requirements for faster loading speeds.
- Reduced Bounce Rates and Improved Conversion Rates
- Flagging actionable items based on priority and impact: Knowing what to fix before fixing it can help you better estimate where you spend your time.
Not sure how to action the items? Get in touch with us today and get recommendations on how and what to prioritise as well options for our expert team to take care of it for you.